On the Up and Up: National vs. Industry Unemployment Rates
and the Gender Wage Gap
As Big Data continues to grow, the need for Data Analysts and other programmers grows along with it. We sought to show a historical analysis of the national unemployment rates in comparison with industry unemployment rates. Our hypothesis is that unemployment rates in the Data Science industry will trend lower than the national average based on the number of opportunities that exist. We wanted to take this one step further and analyze the gender pay gap within the industry to find out if the Data Science industry is making strides in closing the gap. All data was collected from the U.S. Bureau of Labor Statistics (click below to head to the BLS site).
U.S. Bureau of Labor StatisticsNational vs. Industry Unemployment Averages
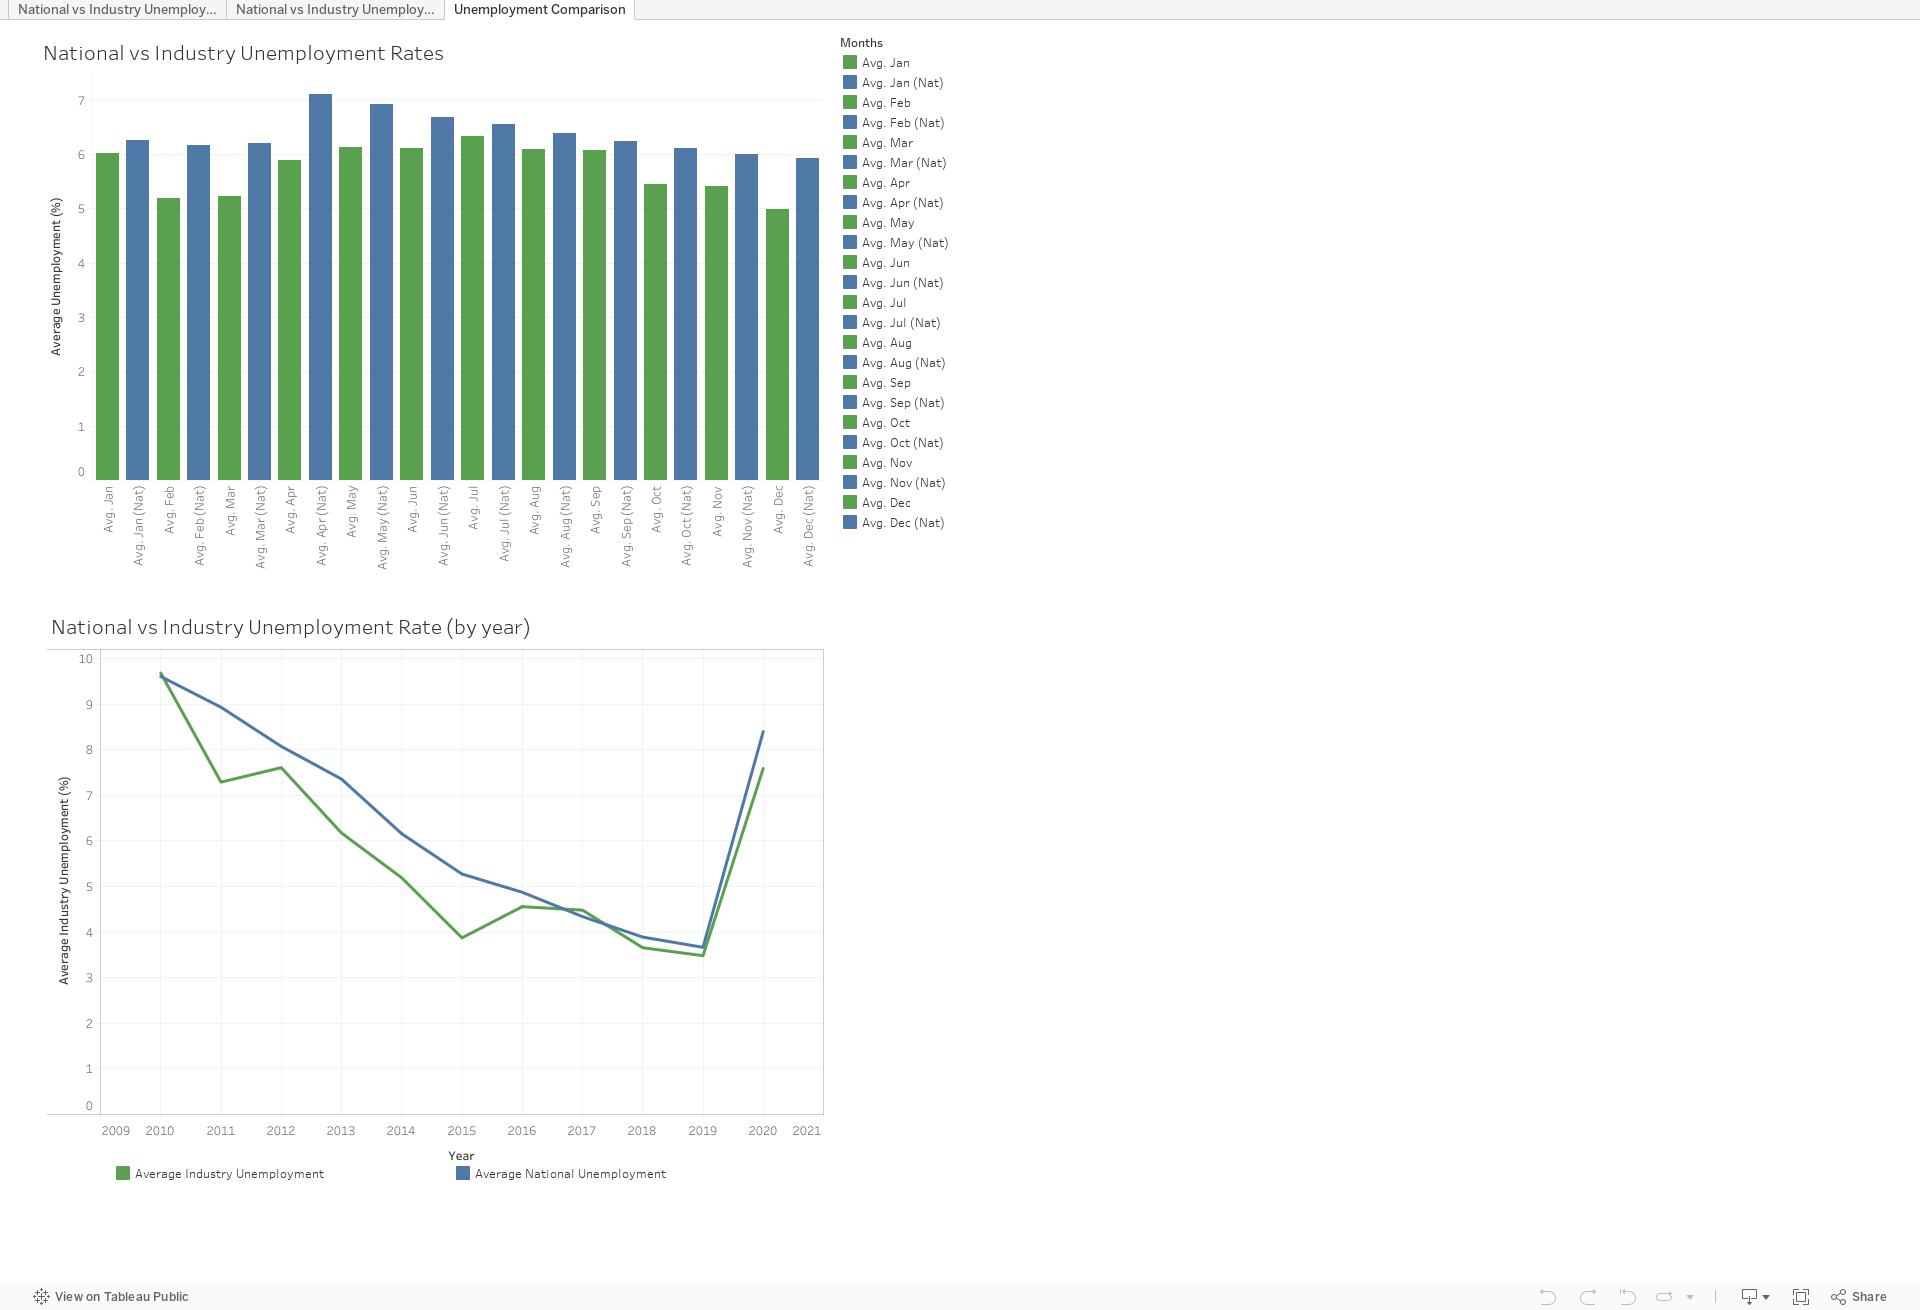
The bar graph above represents the National vs. Industry unemployment rates over a ten year period (2010-2020). Each month represents the average rate for that month over 10 years. It is a general trend that the Data Science industry has a lower unemployment rate than the national average.
National vs. Industry Unemployment Averages by Gender
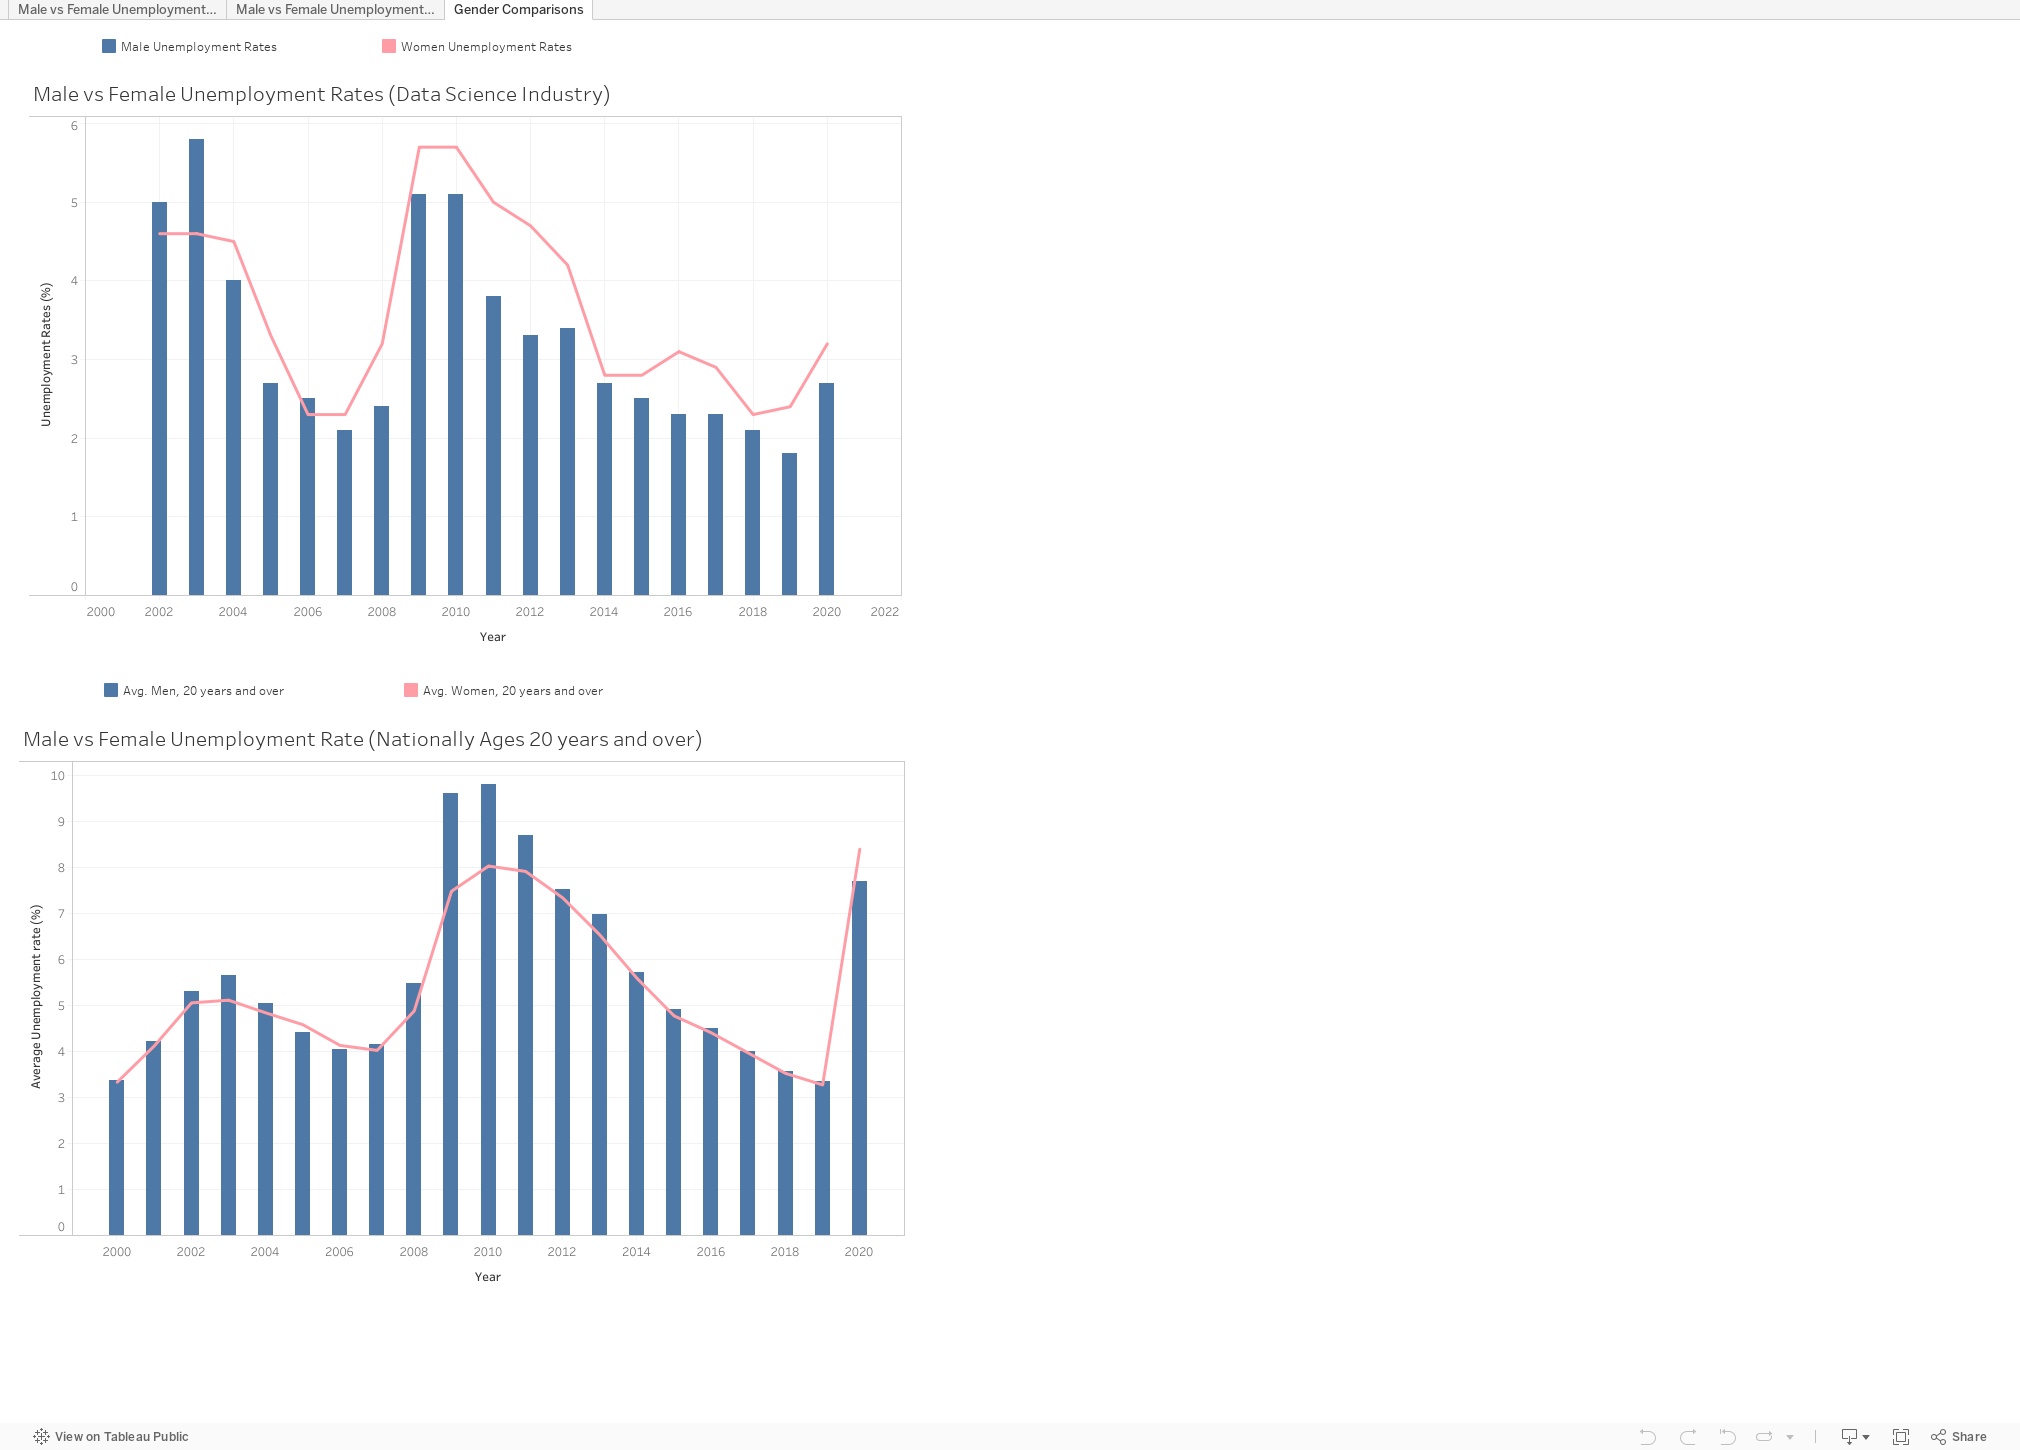
The above bar and line graphs represent the average unemployment rates by gender. Some notable trends are the gaps in average rates between the 2008 recession and the recession that we are currently in. Women’s unemployment rates 2008 were significantly higher than that of men and are increasing exponentially in 2020. Some reasons for the 2020 trend is that more women are being forced to quit their jobs due to the demands of home schooling and other work-life balance demands.
National vs Industry Median Weekly Earnings by Gender
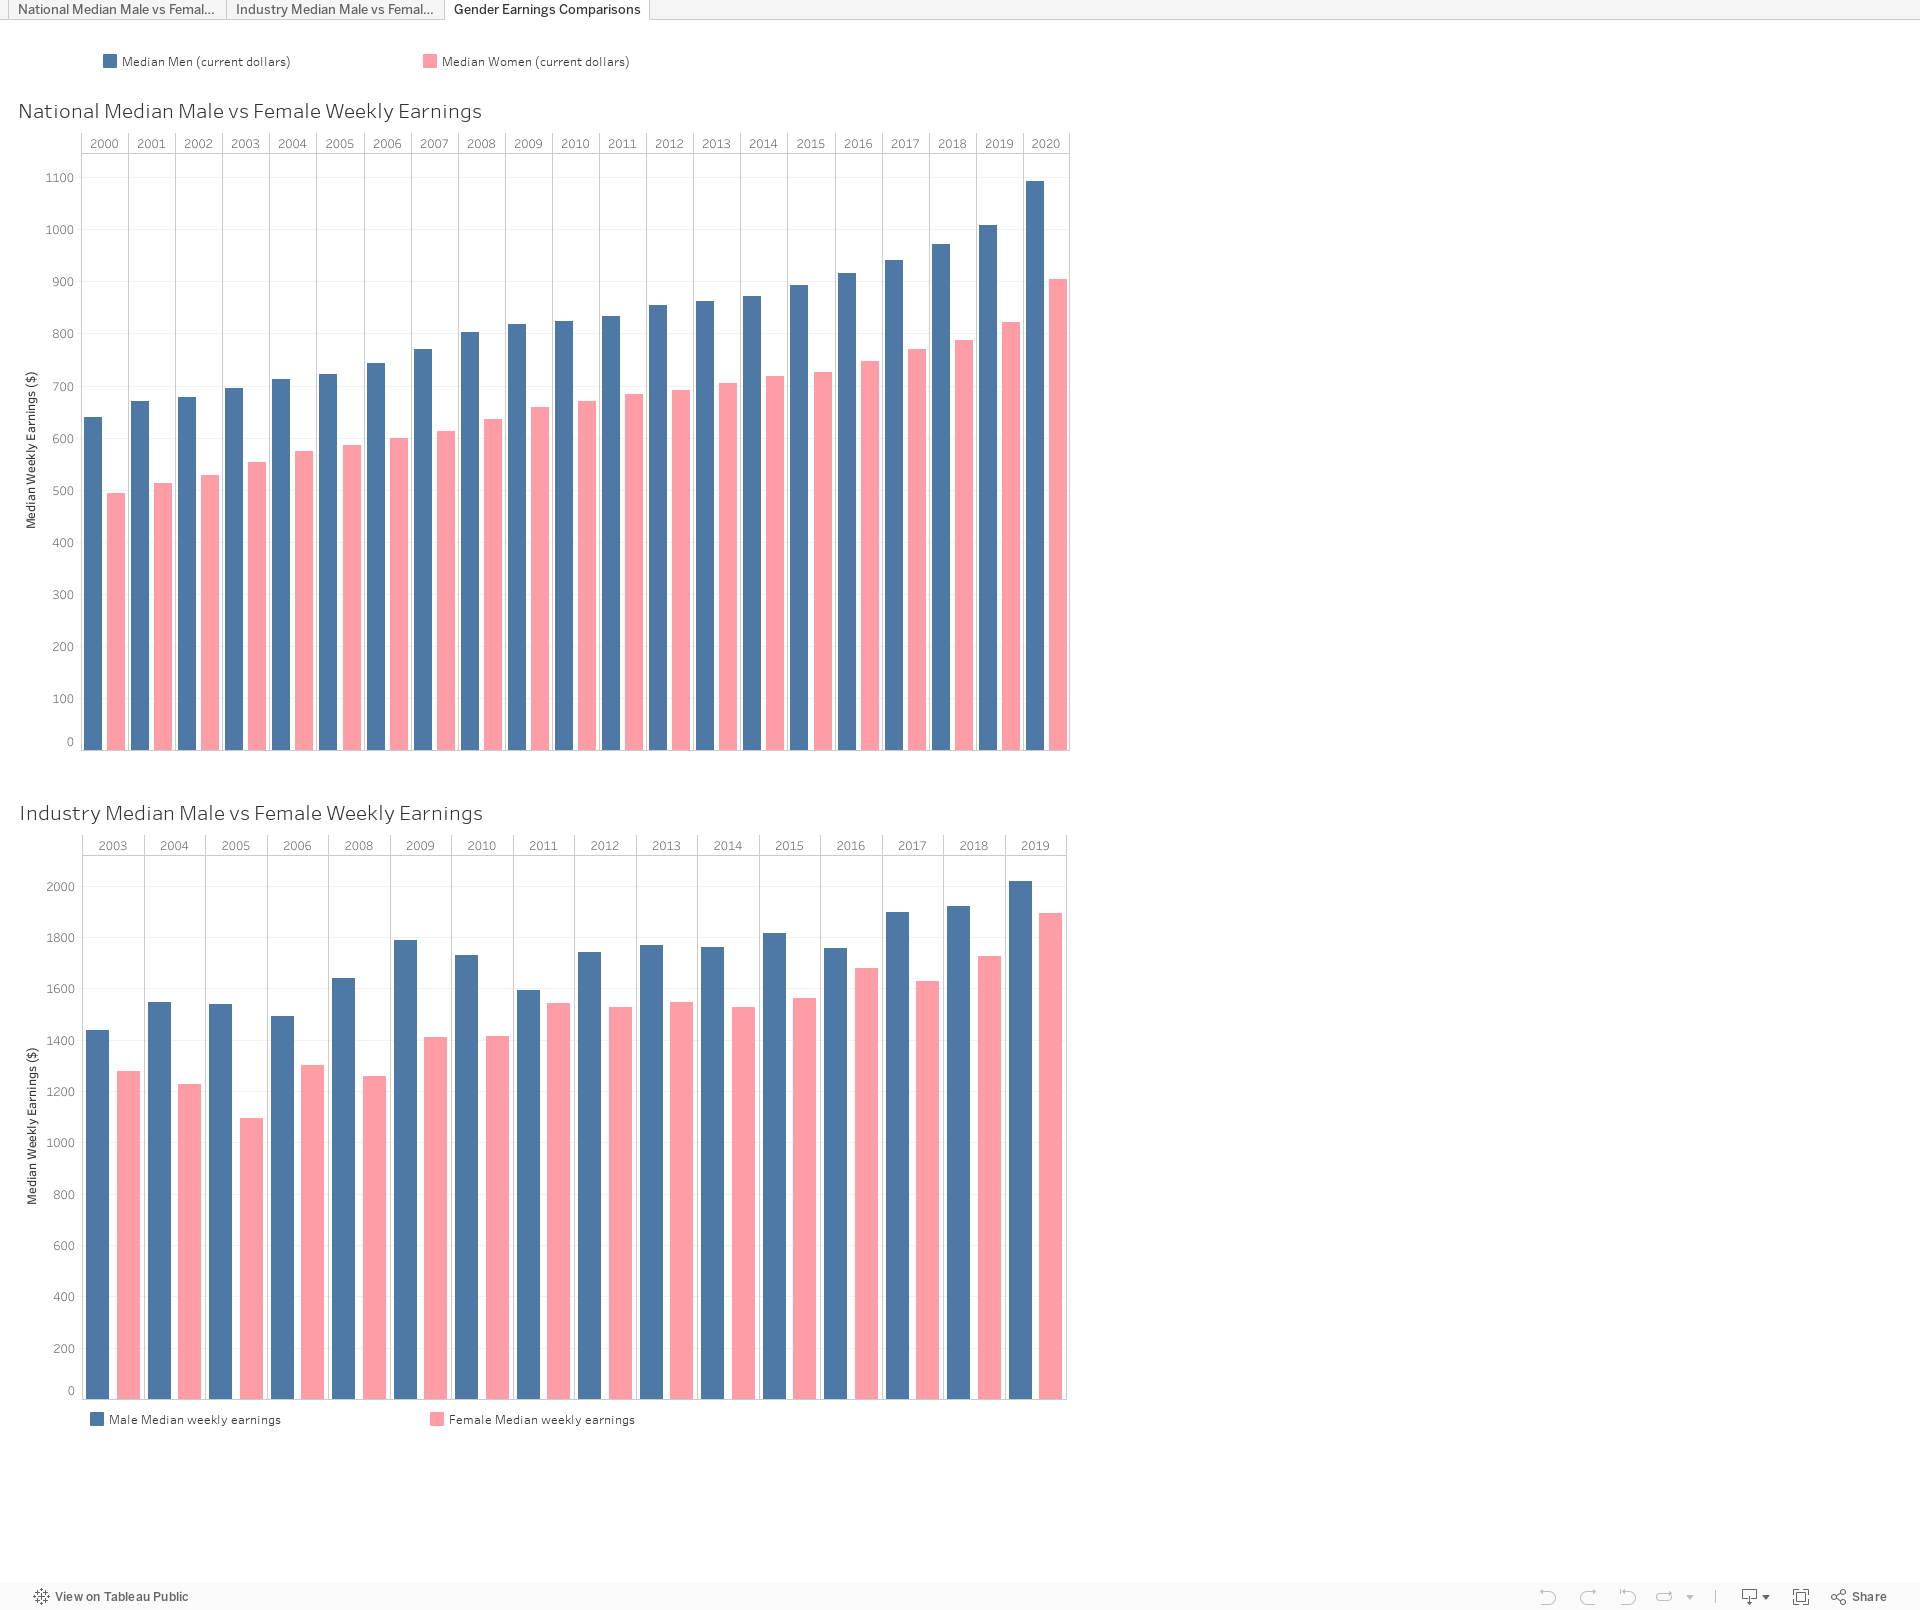
The above bar graphs show that the pay gap between men and women exists, but is closing as time moves forward. However, the national trend for closing the gap is slower than the industry trend.
Median Salaries: National vs. Illinois and by Gender
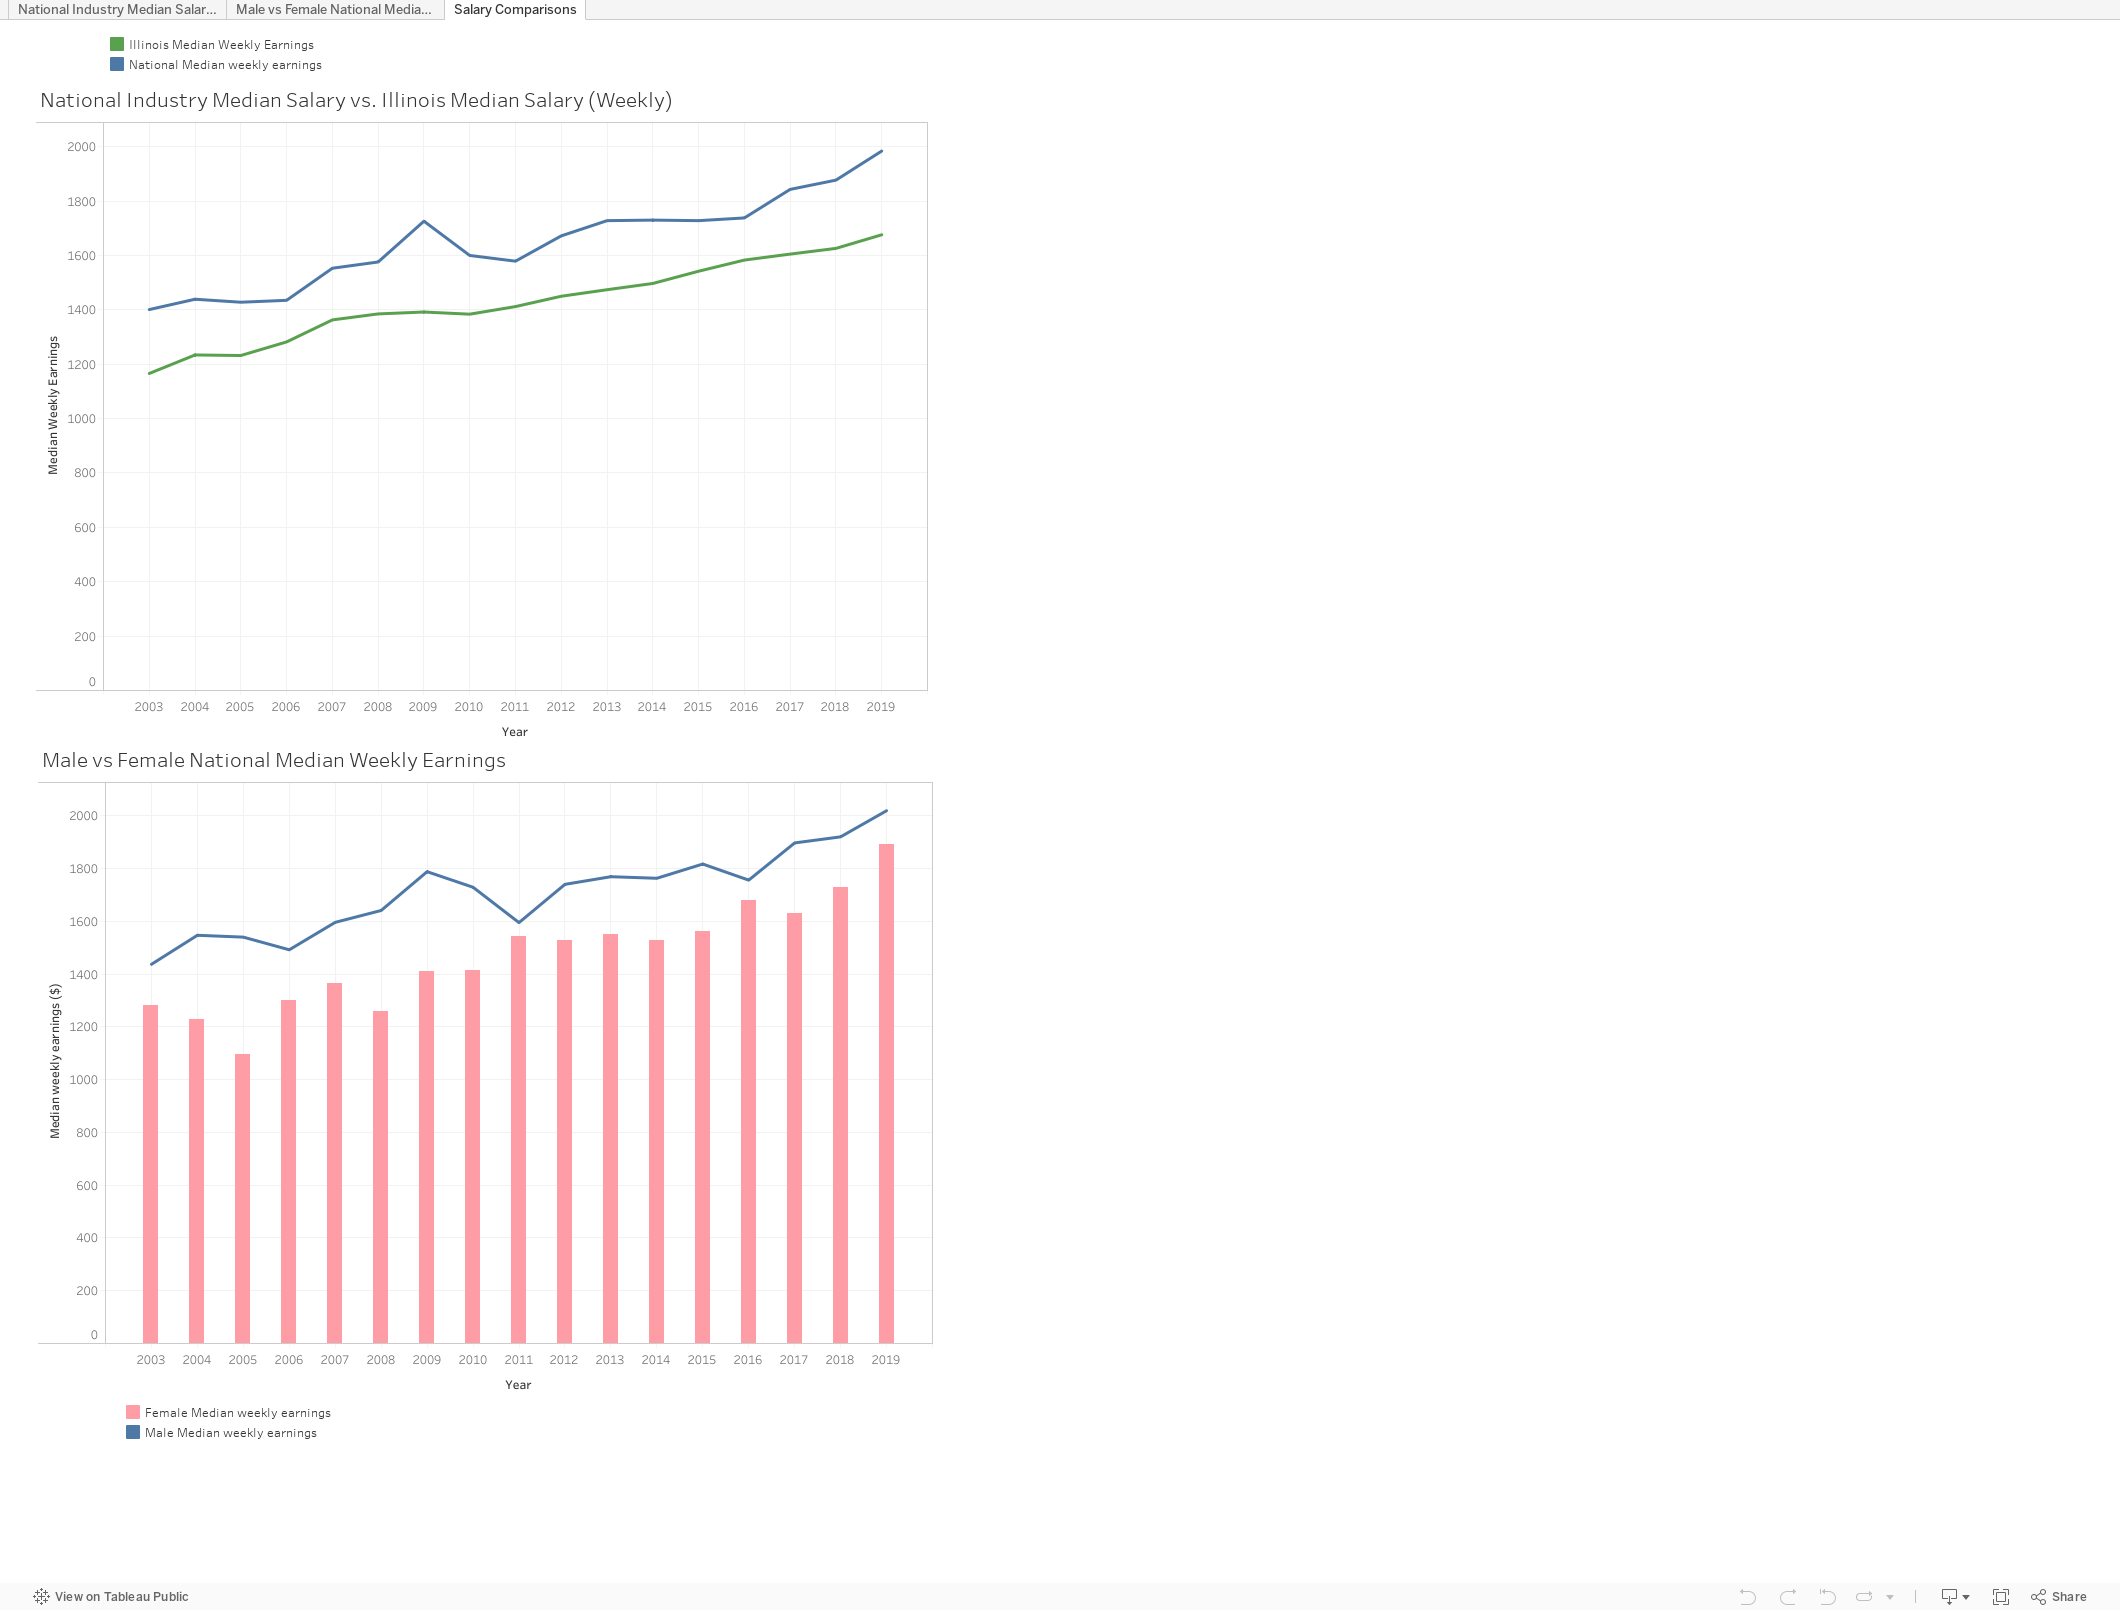
The above graphs show that Illinoisans earn less on average than the national weekly median salary and men earn more than women. We can also see that the Illinois median wage earnings are slightly leveling out as the national median earnings are continuing to grow. It can be noted that the gender pay gap got closer to closing in 2019 in the Data Science industry.
Linear Regression Models
National vs. Industry Pay Gap

MSE: 1.1876148691141675, R2: 0.3410031793525188
National vs. Industry Mean Salary

MSE: 0.2321070852667074, R2: 0.8712058637707997
National vs Industry Unemployment by Gender

MSE: 0.0004808011452877381, R2: 0.9995283824181989